ECE :: Automatic Control Systems
-
In some on-off controllers a differential gap is provided
-
If
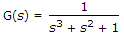 there are
 -
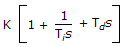
In a proportional plus integral control action
-
An RLC series circuit has

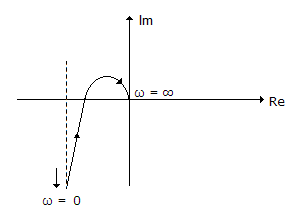
If poles p1 and p1* are close to jω axis, then -
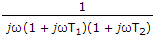
A reactance function


 Whatsapp
 Facebook