Home / ECE / Network Analysis and Synthesis :: Section 22

ECE :: Network Analysis and Synthesis

  1. In low pass filter of figure R0 = 1 Ω and cut off frequency is 1 rad/sec. The values of L and C are

  2. A.
    1 H and 2 F
    B.
    1 H and 1 F
    C.
    2 H and 1 F
    D.
    1 H and 2 F

    View Answer

    Workspace

    Discuss Discuss in Forum


  3. A second order system will have

  4. A.
    all resistances
    B.
    resistances and inductances
    C.
    resistances, inductance and capacitances
    D.
    either (b) or (c)

    View Answer

    Workspace

    Discuss Discuss in Forum


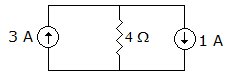
  5. In figure, the power dissipated in 4 resistance is P1 and power associated with 3 A source is P2. Then

  6. A.
    P1 = P2
    B.
    P1 < P2
    C.
    P1 > P2
    D.
    P1 may be equal or less than P2

    View Answer

    Workspace

    Discuss Discuss in Forum


  7. L/C has the dimension of

  8. A.
    time
    B.
    capacitance
    C.
    inductance
    D.
    resistance

    View Answer

    Workspace

    Discuss Discuss in Forum


  9. In metals, the flow of current is due to

  10. A.
    electrons
    B.
    ions
    C.
    holes
    D.
    electrons and ions

    View Answer

    Workspace

    Discuss Discuss in Forum


  11. The shot circuit admittance matrix of a two port network is

  12. A.
    non-reciprocal and passive
    B.
    non-reciprocal and active
    C.
    reciprocal and passive
    D.
    reciprocal and active

    View Answer

    Workspace

    Discuss Discuss in Forum


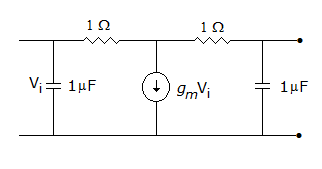
  13. The network shown in figure is

  14. A.
    reciprocal
    B.
    reciprocal and symmetrical
    C.
    non-reciprocal
    D.
    unsymmetrical

    View Answer

    Workspace

    Discuss Discuss in Forum


  15. h parameters are used in transistor analysis.

  16. A.
    True
    B.
    False

    View Answer

    Workspace

    Discuss Discuss in Forum


  17. At a temperature of 7 K, lead is a superconductor.

  18. A.
    True
    B.
    False

    View Answer

    Workspace

    Discuss Discuss in Forum


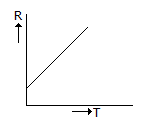
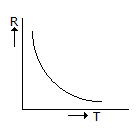
  19. Which of the under-given graphs shown in figure gives variation in resistance of a copper conductor with temperature?

  20. View Answer

    Workspace

    Discuss Discuss in Forum