Data Interpretation :: Line charts
Study the following line graph and answer the questions based on it.
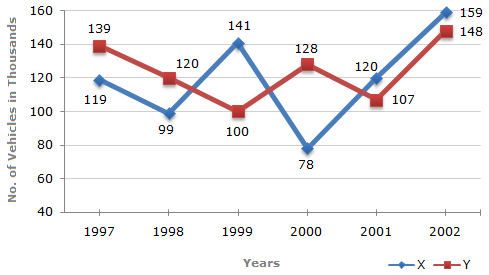
Number of Vehicles Manufactured by Two companies ove the Years (Number in Thousands)
-
What is the difference between the number of vehicles manufactured by Company Y in 2000 and 2001 ?
-
What is the difference between the total productions of the two Companies in the given years ?
-
What is the average numbers of vehicles manufactured by Company X over the given period ? (rounded off to nearest integer)
-
In which of the following years, the difference between the productions of Companies X and Y was the maximum among the given years ?
-
The production of Company Y in 2000 was approximately what percent of the production of Company X in the same year ?

 Whatsapp
 Facebook


 164%
164%