Home / Data Interpretation / Line charts :: Line chart 6

Data Interpretation :: Line charts

Directions To Solve


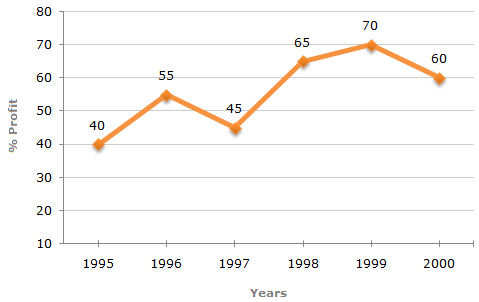
The following line graph gives the annual percent profit earned by a Company during the period 1995 - 2000.

Percent Profit Earned by a Company Over the Years.

%Profit =    \(\frac { \text{ Income -Expenditure}} {Expenditure } \)  x 100             


  1. If the expenditures in 1996 and 1999 are equal, then the approximate ratio of the income in 1996 and 1999 respectively is?

  2. A.

    1:1

    B.
    2:3
    C.

    13:14

    D.

    9:10

    View Answer

    Workspace

    Discuss Discuss in Forum


  3. If the income in 1998 was Rs. 264 crores, what was the expenditure in 1998?

  4. A.

    Rs. 104 crores

    B.

    Rs. 145 crores

    C.

    Rs. 160 crores

    D.
    Rs. 185 crores

    View Answer

    Workspace

    Discuss Discuss in Forum


  5. In which year is the expenditure minimum?

  6. A.

    2000

    B.

    1997

    C.

    1996

    D.

    Cannot be determined

    View Answer

    Workspace

    Discuss Discuss in Forum


  7. If the profit in 1999 was Rs. 4 crores, what was the profit in 2000?

  8. A.

    Rs. 4.2 crores

    B.

    Rs. 6.6 crores

    C.

    Rs. 6.8 crores

    D.

    Cannot be determined

    View Answer

    Workspace

    Discuss Discuss in Forum


  9. What is the average profit earned for the given years?

  10. A.

    50(2/3)

    B.
    55(5/6)
    C.

    60(1/6)

    D.

    335

    View Answer

    Workspace

    Discuss Discuss in Forum