Data Interpretation :: Bar charts
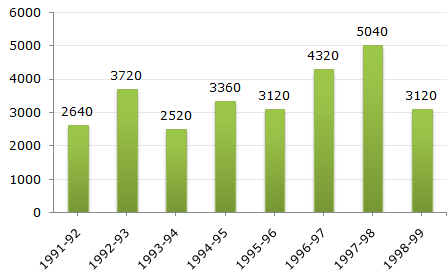
The bar graph given below shows the foreign exchange reserves of a country (in million US $) from 1991 - 1992 to 1998 - 1999.
Foreign Exchange Reserves Of a Country. (in million US $)
-
The ratio of the number of years, in which the foreign exchange reserves are above the average reserves, to those in which the reserves are below the average reserves is?
-
The foreign exchange reserves in 1997-98 was how many times that in 1994-95?
-
For which year, the percent increase of foreign exchange reserves over the previous year, is the highest?
-
The foreign exchange reserves in 1996-97 were approximately what percent of the average foreign exchange reserves over the period under review?
-
What was the percentage increase in the foreign exchange reserves in 1997-98 over 1993-94?

 Whatsapp
 Facebook


 Required percentage = [
  125%.
125%.