Data Interpretation :: Bar charts
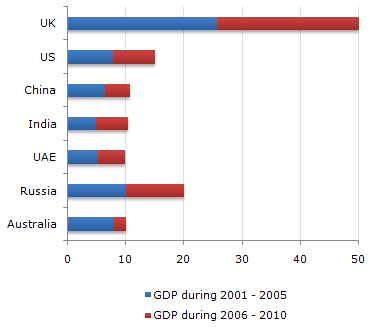
The following bar chart represents the GDP of different countries during the half decades 2001 - 2005 and 2006 - 2010. All figures are in Rs. billion.
GDP of Various Countries
-
Which of the countries listed below accounts for the maximum GDP during the half decade 2006 to 2010 ?
-
The GDP of UAE is what fraction of GDP of the UK for the decade (approximately) ?
-
Which of the countries listed below accounts for the highest GDP during the half decade 2001 to 2005 ?
-
Out of every Rs. 10,000 spent during the decade 2001 - 2010 approximately how much was the GDP of Russia during the half decade 2001 - 2005 ?

 Whatsapp
 Facebook


