Home / Data Interpretation / Bar charts :: Bar chart 19

Data Interpretation :: Bar charts

Directions To Solve

The following bar chart shows the composition of the GDP two countries (India and Pakistan).

Composition of GDP of Two Countries
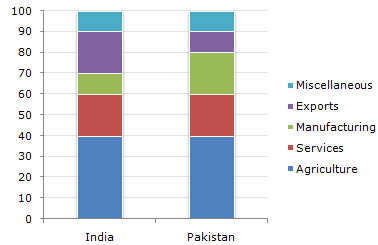
 

  1. If the total GDP of Pakistan is Rs. 10,000 crore, then a GDP accounted for by Manufacturing is ?

  2. A.

    Rs.200 crore

    B.

    Rs.600 crore

    C.

    Rs.2,000 crore

    D.

    Rs.6,000 crore

    View Answer

    Workspace

    Discuss Discuss in Forum


  3. What fraction of India's GDP is accounted for by Services ?

  4. A.

    (6/33)th

    B.

    (1/5)th

    C.

    (2/3)rd

    D.

    None of these

    View Answer

    Workspace

    Discuss Discuss in Forum


  5. If the total GDP of India is Rs.30,000 crores, then the GDP accounted for by Agriculture, Services and Miscellaneous is ?

  6. A.

    Rs.18,500 crore

    B.

    Rs.18,000 crore

    C.

    Rs.21,000 crore

    D.
    Rs.15,000 crore

    View Answer

    Workspace

    Discuss Discuss in Forum


  7. Which country accounts for higher earning out of Services and Miscellaneous together ?

  8. A.

    India

    B.

    Pakistan

    C.

    Both spend equal amounts

    D.

    Cannot be determined

    View Answer

    Workspace

    Discuss Discuss in Forum


  9. If the total GDP is the same for both the countries, then what percentage is Pakistan's income through agriculture over India's income through Services ?

  10. A.

    100 %

    B.

    200 %

    C.

    133.33 %

    D.

    None of these

    View Answer

    Workspace

    Discuss Discuss in Forum