Data Interpretation :: Bar charts
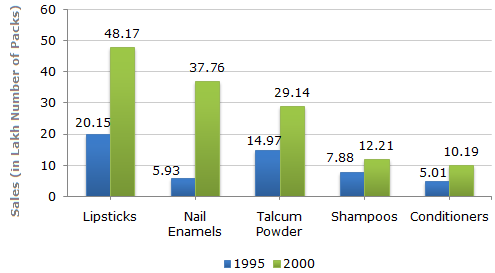
A cosmetic company provides five different products. The sales of these five products (in lakh number of packs) during 1995 and 2000 are shown in the following bar graph.
Sales (in lakh number of packs) of five different products of Cosmetic Company during 1995 and 2000
-
The sales of lipsticks in 2000 was by what percent more than the sales of nail enamels in 2000? (rounded off to nearest integer)
-
During the period 1995-2000, the minimum rate of increase in sales is in the case of?
-
What is the approximate ratio of the sales of nail enamels in 2000 to the sales of Talcum powders in 1995?
-
The sales have increase by nearly 55% from 1995 to 2000 in the case of?
-
The sales of conditioners in 1995 was by what percent less than the sales of shampoos in 1995? (rounded off to nearest integer)

 Whatsapp
 Facebook


 28%.
28%. The minimum rate of increase in sales from 1995 to 2000 is in the case of Shampoos