Data Interpretation :: Bar charts
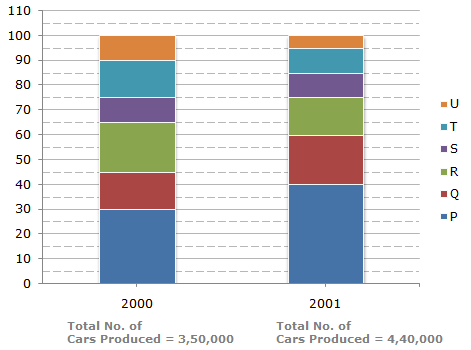
The bar graph given below shows the percentage distribution of the total production of a car manufacturing company into various models over two years.
Percentage of Six different types of Cars manufactured by a Company over Two Years
-
What was the difference in the number of Q type cars produced in 2000 and that produced in 2001?
-
Total number of cars of models P, Q and T manufactured in 2000 is?
-
If the percentage production of P type cars in 2001 was the same as that in 2000, then the number of P type cars produced in 2001 would have been?
-
If 85% of the S type cars produced in each year were sold by the company, how many S type cars remain unsold?
-
For which model the percentage rise/fall in production from 2000 to 2001 was minimum?

 Whatsapp
 Facebook


 Required difference = (88000 - 52500) = 35,500.